Residential Installations
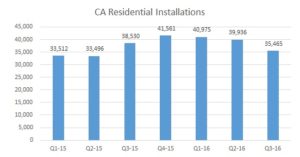
Residential solar installations fell 8% in Q3 vs. the prior year. Industry analysts believe this may be due to saturation in areas that are strong fit for solar as well as the impact of the election uncertainty. Reuters covered this trend in its recent article on the San Diego solar market.
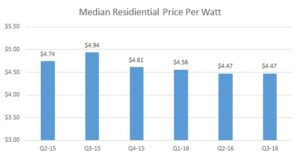
Median Price Per Watt
The median price per watt for a residential installation declined nearly 10% vs. the prior year to $4.47. This is largely due to module price declines (as much as 30%), as noted by Greentech Media.
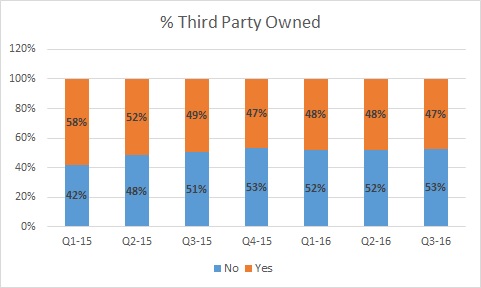
Third-Party Owned
The percentage of third-party owned system in California declined to 46.5% from 58.2% in Q1-15. In California, the shift to customer-owned systems is expected to continue and is being driven by several factors including, (i) a slowdown by large national installers and (ii) expansion of attractive loan alternatives for consumers. On a national basis, the trend is being driven by growing solar markets in states (FL and UT) that do not allow third-party ownership.
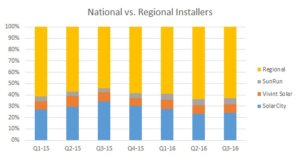
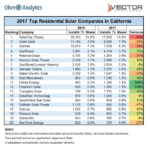
National Installer Market Share
National installer market share fell to 37% from 46% in the prior year. This was due to a pull-back in acquisition spend by the national installers and increasing platform and technology support for regional installers.
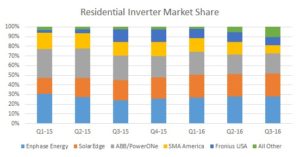
Residential Inverter Market Share
Enphase Energy and SolarEdge continued to growth their market share to 52% in Q3-16 from 47% in Q1-15. Most of this share has come from ABB/PowerOne and the two companies are “facing the fight of their lives”
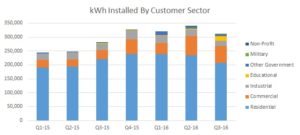
Installations By Customer Sector
As the residential market has slowed, commercial installations increased 85% from Q3-15. Commercial solar has proven harder to scale, particularly smaller scale commercial. The growth has been supported by corporate solar investments, such as Google, which is expected to reach 100% renewable-sourced by 2017.






The headline says “California Solar Market,” but the comments regarding leased vs. owned systems implies that sales in FL and UT have affected the results. Either the headline or the comment must be wrong. In Chart 4 (“National Installer Market Share”) are the market shares just for CA or for the US as a whole?
Bruce – thank you for the feedback. We clarified the wording – the chart reflects data in California only.