Residential Installations
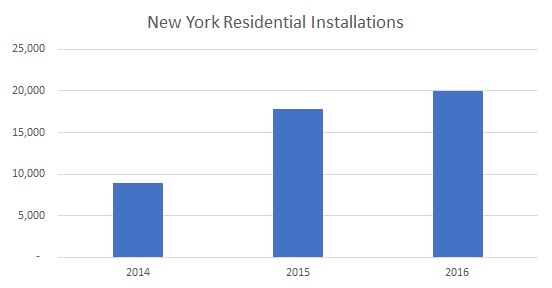
Residential solar installations in New York increased 12% in 2016 to 19,945, which is a significant slowdown from 100% growth in 2015. Industry analysts believe this may be due to saturation in areas that are strong fit for solar as well as the impact of the election uncertainty. Reuters covered this trend in its recent article.
Average Price Per Watt
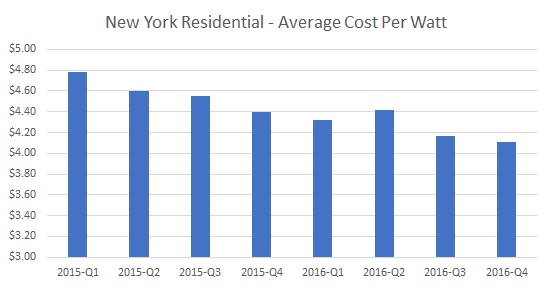
The average price per watt (before incentives) for a residential installation in Q4-16 declined nearly 5% vs. the prior year to $4.11 and nearly 14% vs. Q1-15. This is largely due to module price declines (as much as 30%), as noted by a recent article from Reuters on Sunpower, the second largest U.S. panel maker.
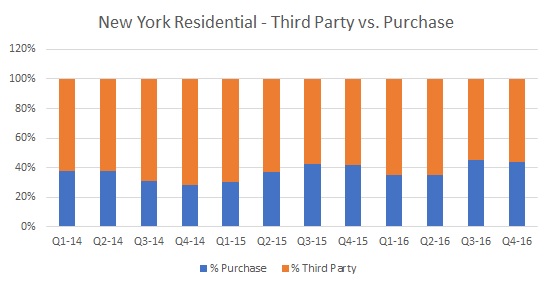
Third-Party Owned
The percentage of third-party owned system declined to 56% from an average of 62% in 2015. The shift to customer-owned systems is expected to continue and is being driven by several factors including, (i) a slowdown by large national installers, (ii) expansion of attractive loan alternatives for consumers and (iii) growing solar markets in states (FL and UT) that do not allow third-party ownership.
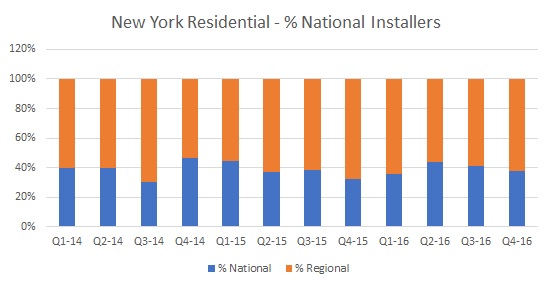
National Installer Market Share
National installer market share increased to an average of 40% in 2016 vs. 38% in 2015. This is counter to the trend in California, which experienced a declining national solar installer market share. Increasing platform and technology support has boosted regional installers across the country.
Installations By Customer Sector
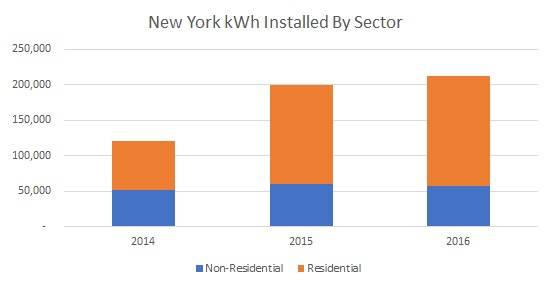
As the residential sector increased, the non-residential (commercial, industrial, public, and military) declined slightly (3%).
Fastest Growing Cities
Solar has proven to be a contagious product with referrals in local areas driving installation density. The list below of the top 50 fastest growing solar cities in New York excludes New York City, which is summarized by NYC county below. New York City has set ambitious solar goals.
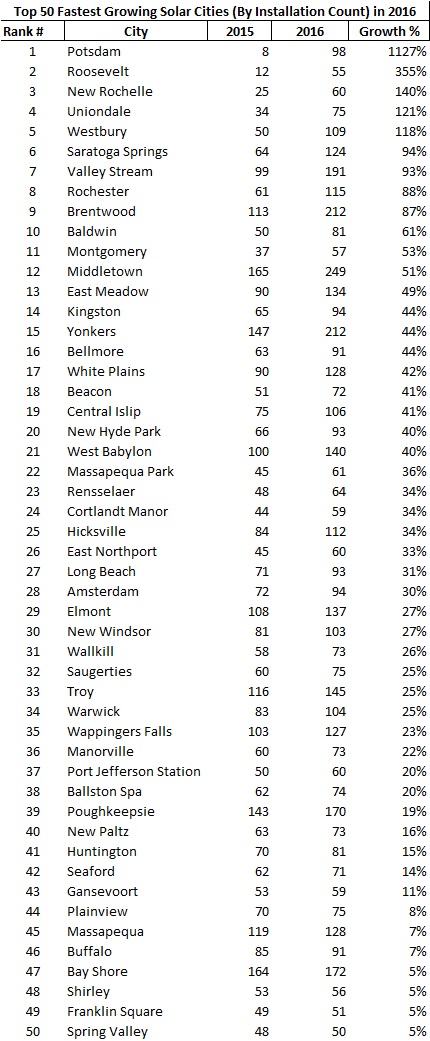

These statistics were produced with the NYSERDA solar data set, which includes installation data through November of 2016 and estimates were used for December of 2016 for comparability to prior years. All charts use the “Completed Date”.


