What is PV Penetration
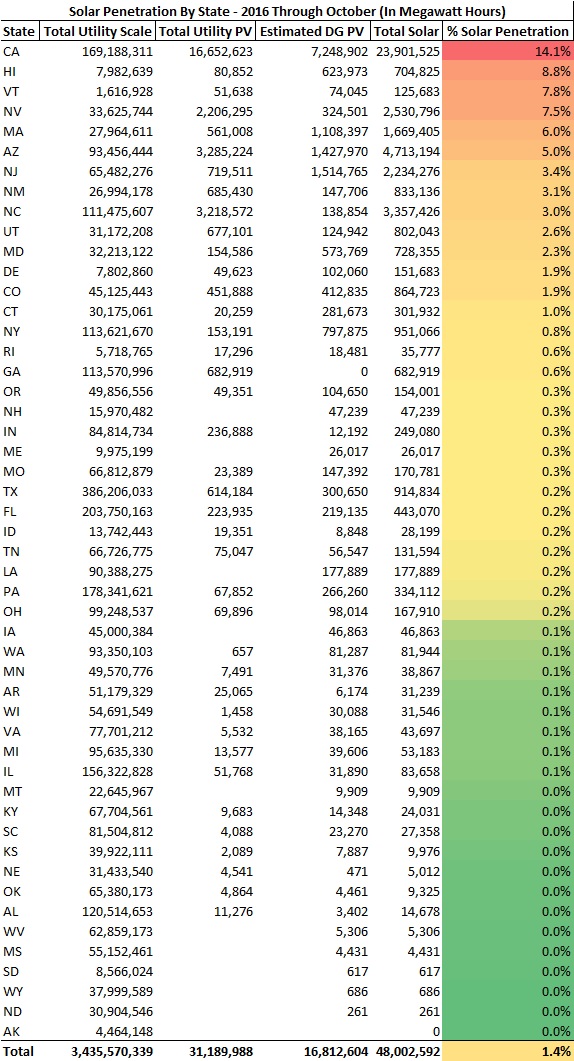
Solar penetration can be defined as the percentage of electricity generation that is sourced from solar facilities (the vast majority of solar electricity is from photovoltaic of PV). This can be measured in total capacity or by the hours of power. Despite significant growth in solar installations in in the last 10 years, solar still only represents ~1.5% of electricity in the U.S. Solar penetration varies by state as presented in the chart below.
Solar Penetration By State
The chart below uses information from the Energy Information Adminstration’s (EIA) Electric Power Monthly to estimate the percentage of electricity that was sourced from solar. The information is measured in megawatt hours for the first 10 months of 2016. For context, the typical home will use approximately 10 megawatt hours of power in a year. The report includes utility scale PV or large facilities that sell power directly to a utility (typically via a PPA). We have also added in an estimate from the EIA for the distributed PV, or solar systems that are onsite at homes or businesses. Distributed systems use the power directly and sell the excess back to the grid (via net metering arrangements). California leads the nation with nearly 15% of its electricity sourced from solar.

High PV Penetration
In states where electricity prices are high and solar incentives are attractive (California and Hawaii), the penetration of solar has reached levels that can present challenges to the grid operators. As 2014 report from the Energy Department on PV penetration in Hawaii covers these topics. The main challenges are due to intermittent nature of solar and the coordination of more numerous distributed systems. Solar generation varies throughout the year and hours of the day.
Rooftop Solar Penetration
Another definition of solar penetration, is the percentage of residential homes that have installed solar systems within a given area. Solar has proven to be a contagious product with sales in clusters within neighborhoods. This is due to high levels of referrals with the percentage of customers with solar exceeding 20% in zip codes in California and Arizona. The high PV penetration in California is due in part to the high electricity prices (see Choose Energy’s electricity rates by state). The links below include detailed maps of solar penetration by zip code in California and Arizona.
[su_note note_color=”#d8f4fd” text_color=”#ffffff” radius=”3″ class=””]
OhmHome 2017 Product Guides:
[/su_note]


