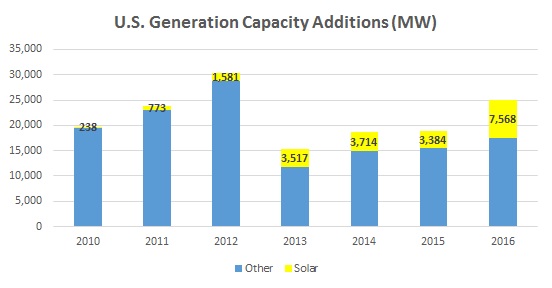
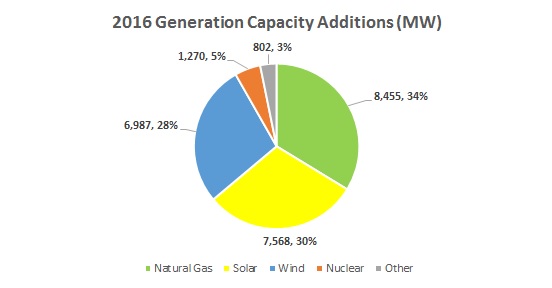
The U.S. added over 25,000 MWs of new generation capacity in 2016 according to EIA’s Monthly Electric Generator Inventory report. Solar capacity additions reached a new record of 7,568 MWs, more than double 2015 additions of 3,384. Solar capacity by state varied significantly as detailed in the analysis below. As a percentage of total capacity, solar increased from 18% in 2015 to 30% in 2016. Note that the data includes actual additions through October with the last two months of the year based on planned additions. Of the 2016 renewable additions, nearly 60% were scheduled to come online during the fourth quarter. Renewable capacity additions are often highest in the final months of the year, primarily due to the timing qualifications for federal, state, or local tax incentives.

Despite significant growth in solar installations in in the last 10 years, solar still only represents ~1.5% of electricity in the U.S. For more information related to current solar penetration rates by state, read our Solar Penetration By State recap.
Solar, wind and natural gas accounted for over 92% of capacity additions. Natural gas capacity additions were boosted by the lowest natural gas prices in the last 20 years. Natural gas spot prices in 2016 averaged $2.49 per million British thermal units (MMBtu) at the national benchmark Henry Hub, the lowest annual average price since 1999. The 1,270 MWs of nuclear capacity was due to the Tennessee Valley Authority’s Watts Bar Unit 2, the first new nuclear generation in the U.S. in the last 20 years.

2016 Solar Capacity Additions By State
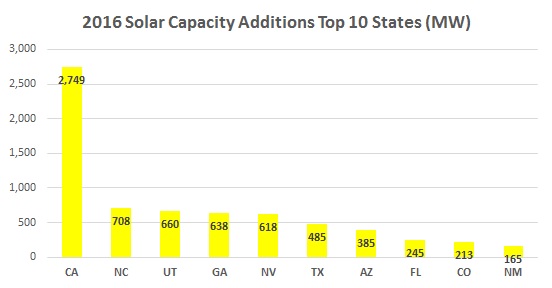
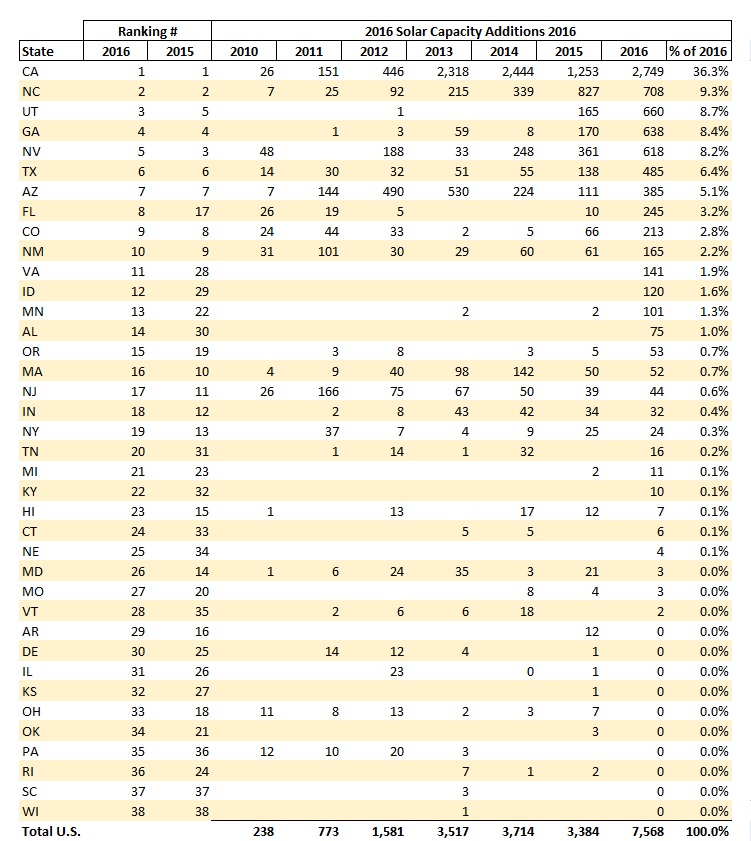
California accounted for over 36% of new solar capacity in the U.S. in 2016 with 2,749 MWs and in total the top 10 states accounted for over 90%. North Carolina remain 2nd behind California in 2016 with 708 MWs. The charts below provide the details for the top 10 and all states.

2016 Solar Capacity By State


