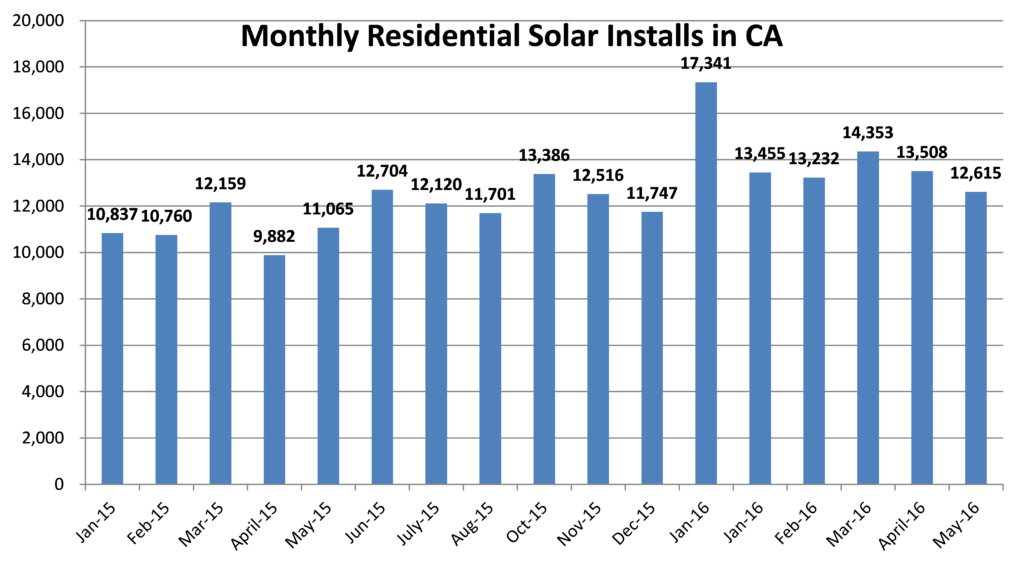
The residential solar market in California increased by 22.8% through May of 2016 versus the same period in 2015, increasing from 54,703 installations in 2015 to 67,163 in 2016 YTD.
Eight of the top 20 fastest growing zip codes during that period were located in San Diego County (San Diego, Chula Vista, Lemon Grove,and Carlsbad) and six were located in Los Angeles County (Buena Park, Rowland Heights, Norwalk, La Puente, Bellflower and West Covina).
The fastest growing zip code was 95122 in San Jose in Santa Clara, increasing by over 300% from 29 installs in 2015 YTD to 117 in 2016 YTD. The map below includes all California zip codes that had at least 100 installations in 2016 (223) and their respective growth.
See the charts below the map to view the full list of the top 20 fastest growing solar zip codes and the monthly installation volumes for 2015 and 2016.
Eight of the top 20 fastest growing zip codes during 2016 were located in San Diego County.

The residential solar market in California increased by 22.8% through May of 2016 versus the same period in 2015, increasing from 54,703 installations in 2015 to 67,163 in 2016 YTD.

This analysis was based on data from the California Solar Initiative using the Net Energy Metering Interconnection dataset and the App Approved date. This accounts for an estimated 85% of all installations in California.
For an interactive database on projects and pricing (where available) by installer, city and zip code visit Solar Leaderboard, the leading source for solar market data and competitive analysis.


