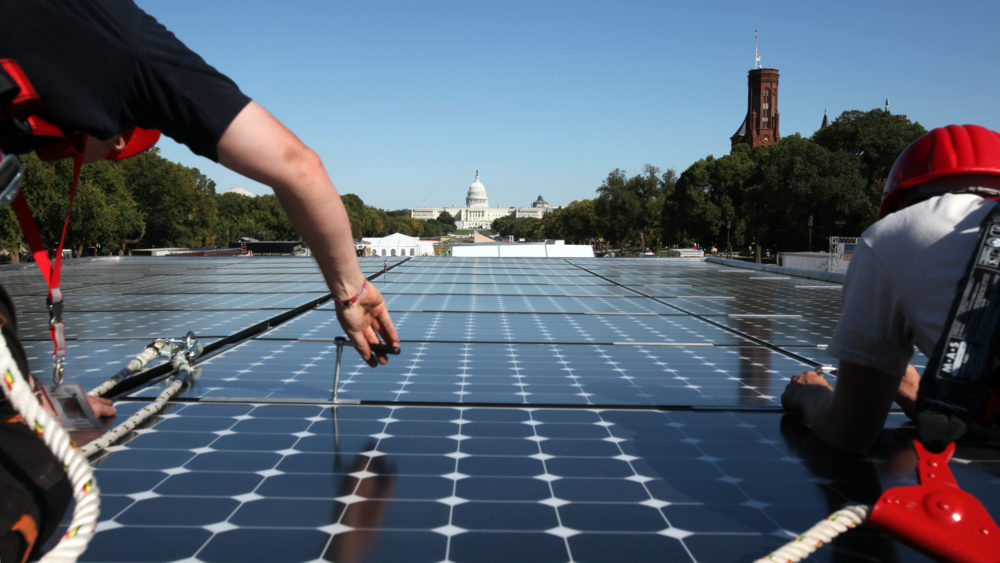
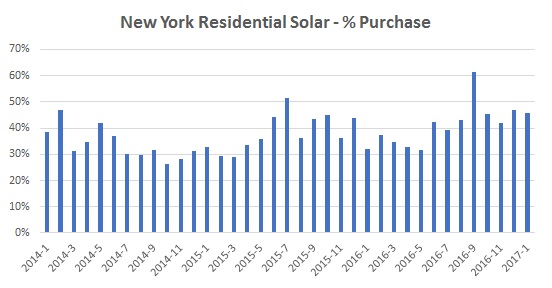
Recently released data from NYSERDA demonstrates the increasing trend of consumers electing to purchase solar vs. lease (lease or power purchase agreement). In January in New York, the percentage of residential solar systems purchased was 46%, validating the shift that began in mid-2016 to purchases vs. leases. The same trend was seen in California, which experienced an increase in purchased systems from 42% in the beginning of 2015 to 53% in Q3-16.
Solar Loan Capital Markets Activity
In 2015 and 2016, there has been an increasing number of solar loan options for consumers that has been supported by capital markets activity. In early February 2017, Mosaic completed its first securitization of residential solar loans. The offering consisted of a single tranche of $138.95 million notes rated “A” by Kroll Bond Rating Agency that was supported by a collateral pool of $178 million of loans. The securization is an important milestone in itself, but the sale process provides insight into institutional investor appetite for solar loans. The deal reportedly generated an oversubscription level of 5.6 times the offering size, indicating a healthy interest in the asset class.
Consumer Investment Options
Although public solar data does not breakout the purchase volume between cash and loans, cash transactions may also be helping drive the shift to purchase. With prices falling rapidly (our NY solar research indicates a ~15% decline in 2016), the solar investment size and returns have become more attractive to consumers as they evaluate the solar lease vs. buy decision. A 2016 analysis reported an average IRR in the U.S. of 9.24% for solar vs. the 25 year performance of the S&P of 7% with an IRR in some states (MA, NY and NJ) of greater than 20%. With U.S equities reaching all-time highs, solar may be a more attractive investment option for retirees and all other homeowners.
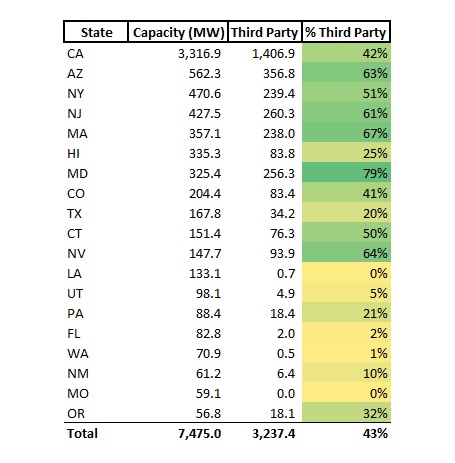
Solar Third-Party Ownership By State
The percentage of third-party ownership varies significantly by state according to the EIA’s net metering report. The U.S. average of total installed capacity as of November 2016 was 43% within some states such as MA and MD at greater than 65% with other states such as TX, HI and UT at less than 25%.
