Sunvago recently published its 2016 50 top solar companies in NY and has supplemented the list with an analysis of the competitive environment in the solar industry in New York and a recent Installer Survey report from Energy Sage. The analysis uses the NYSERDA solar database as of the end of 2016.
Insights on Competitive Landscape of Residential Solar From EnergySage
EnergySage recently released its 2016 Solar Installer Survey and found the following conclusions related to the competitiveness of the solar industry:
- Nearly half of all installers surveyed are directly competing with 20 or more other companies for business
- Installers were divided on how the solar industry will evolve over the next few years – 51% believe there will be more installers, 12% believe there will be no change and 37% believe there will be fewer installers
- Similarly, 54% believe that small local installers will take share from larger national installers
- The top 5 competitive advantages (in order of significance) were higher quality installations, consultative sales processes, higher quality equipment, more qualified labor and lower prices offered
Analysis of Competitive Landscape in New York
To supplement the EnergySage report, we conducted an analysis of the competitive landscape in New York with a focus on the top 50 solar companies in NY and how the top 50 as of 2014 have performed through 2016.
The top 5 companies (“National”) increased their share from 54% to 57% and the regional and mid-tier combined stayed approximately the same at ~34% while the small and very small lost 4% share. The decline in share of the small and very small contractors can be seen as well in the decline of total solar companies (as defined as at least one installation) from 251 to 207. So the distribution is becoming tighter, which may be the result of a rapid decline in pricing (that may have squeezed margins for smaller installers) offset by an increase in acquisition and finance resources for well-qualified mid-tier installers.
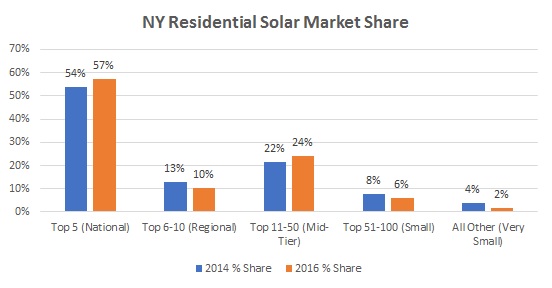
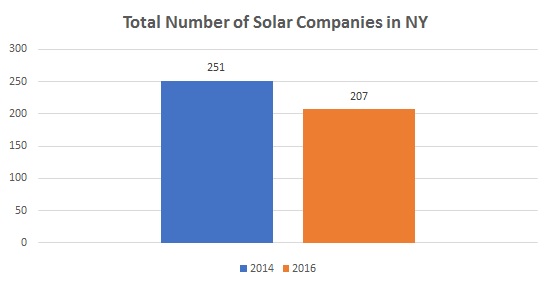
This analysis is helpful in understanding the performance of market segments, but does not illustrate the individual company churn. To illustrate the individual company trends, we analyzed the performance of the 2014 top 50 from 2014 to 2016 and compared their performance against the overall market in New York, which increased 124% from 8,878 installations in 2014 to 19,861 installations in 2016.
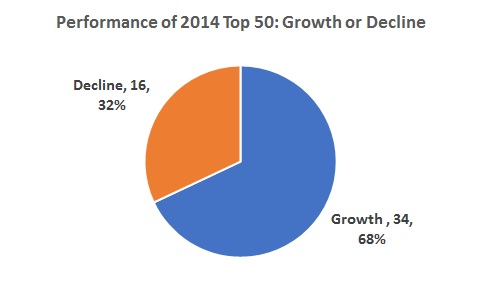
Of the 2014 top 50, 34 or 68% of the group experienced installation growth from 2014 to 2016.
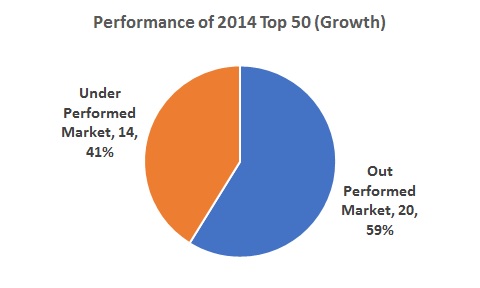
Of the 34 companies that experienced growth, 59% or 20 outperformed the market vs. 41% that under performed.
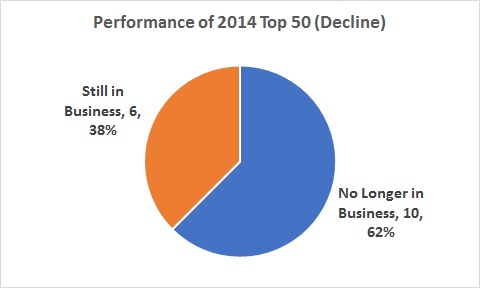
Of the 16 companies that experienced a decline in installations, 10 of them are no longer in business or 20% of the total 50, which demonstrates the competitiveness of the residential solar industry.
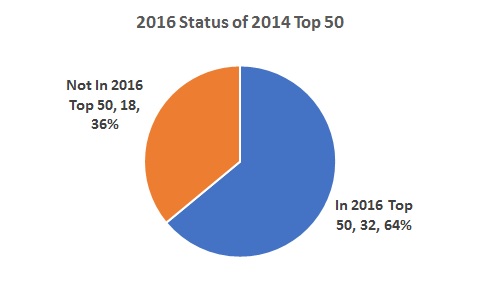
Lastly, of the 2014 top 50, only 32 companies or 64% remained in the top 50 as of 2016.
For more information, review Sunvago’s full list of the 2016 top 50 solar companies in NY.


