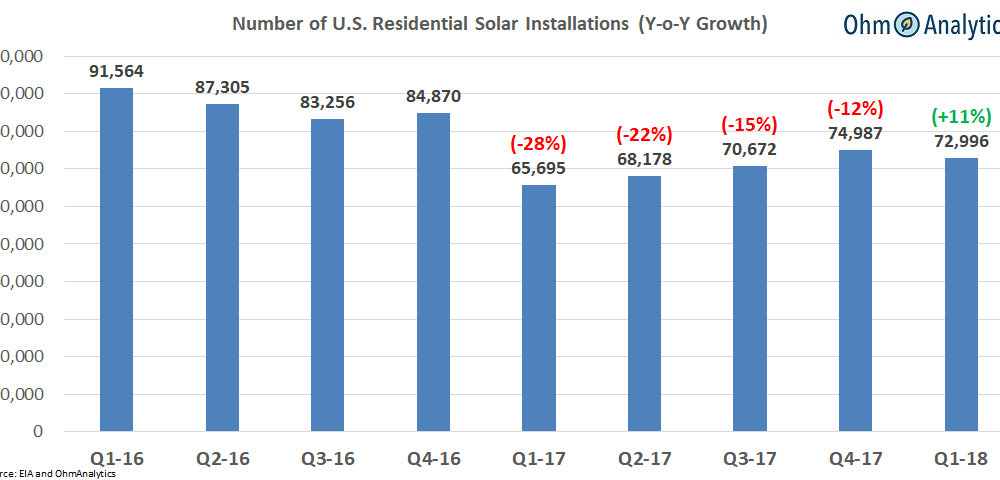
After a difficult 2017, the residential solar market returned to growth in Q1-18, posting the first year-over-year growth quarter (+11%) since 2016. Below are the estimated quarterly installation volumes for Q1-18 in the U.S. based on EIA’s net metering report and Ohm Analytics’ proprietary database of U.S. solar projects.

California Residential Market Shines
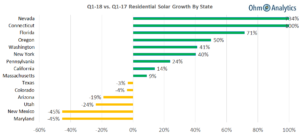
California, which accounts for nearly 1/2 of the total U.S. solar market, increased 14% year-over-year and developing solar markets, including Nevada and Florida, also lifted the market. Ohm Analytics attributes the growth in California to two primary factors: (i) steadily increasing California home values and (ii) increasing solar+storage installations (discussed in more detail below).
- Strong California Housing Market – Home values in major metros in California have experienced nearly double digit growth in 2017 and have reached record highs. Home equity gains are a major driver in home improvement spending, particularly for those projects that are primarily financed such as residential solar.
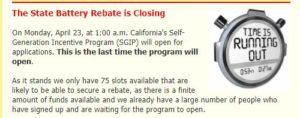
- Increase in Solar+Storage Installations – Decreasing battery costs and state incentives have increased consumer interest in solar+storage installations and solar companies are using the opportunity to market to consumers. Below is an example of promotions that installers are using to drive interest and urgency with solar +storage installations.
About Ohm Analytics
Ohm Analytics is the data service division of OhmHome, the online platform that is guiding consumers through the energy revolution. Ohm Analytics proprietary data is used in OhmHome’s consumer content and recommendation tools. Our data services are also leveraged by a wide range of solar market participants, including installers, distributors, manufacturers, lenders and other service providers. For more information about our data services, complete the form here or email us at (research [at] ohmhomenow.com).
Solar Index Methodology
- OhmHome’s Solar Index analyzes solar permit data on a quarterly basis for geographies in which the data is readily available. The permit data is combined with total installation data from the EIA to extrapolate growth in the overall U.S. market
- The Solar Index currently covers most major solar markets spanning 17 states and over 40 cities. The states included in the Solar Index represent more than 85% of the total market
- The Solar Index is meant to be a sampling that is representative of the market to provide real-time insight into the residential solar market performance.


